
CONTENT AND THEMATIC ANALYSIS
SPECIFICATION: Content analysis and coding. Thematic analysis

INTRODUCTION
Before diving into content analysis, students shoukd know key concepts from the chapter on qualitative and quantitative data (see https://www.psychstory.co.uk/data-handling-inferential-statistics/). Qualitative data underpins not only content analysis but most non-experimental research, offering idiographic insights into complex behaviors, like why people smoke, through open-ended questions (e.g., “Why do you smoke?”) that prioritise validity over fixed-choice quantitative options (e.g., ticking “to reduce stress”). Non-experimental methods are favoured in psychology due to ethical constraints and confounding variables that complicate true experiments on humans, providing an alternative to nomothetic, quantitative approaches Although they don't show cause and effect using various techniques does enable triangulation.
Content analysis, a method that bridges qualitative and quantitative research, systematically codes and quantifies qualitative data (e.g., interview transcripts, media texts) to identify patterns, themes, or frequencies, such as counting recurring reasons for smoking in open-ended responses. This hybrid approach retains the depth of qualitative insights while allowing structured, numerical analysis, making it a versatile tool for psychological research.
TYPES OF QUALITATIVE RESEARCH METHODS
CASE STUDY
A close, detailed investigation of one person, a small group, or a unique case. Many types of information are collected to build a full picture.
Example (smoking): Follow one smoker’s life in detail — their family background, health, friends, and attempts to quit — to see how all these factors interact.
ETHNOGRAPHY
The researcher spends time inside a group or community to understand behaviour in its natural setting.
Example (smoking): Live in a community where smoking is common and record how it is part of daily routines, signals social status, or is used in group gatherings.
GROUNDED THEORY
A method where data is collected first, and then a theory is built from it, rather than starting with a fixed idea.
Example (smoking): Keep interviewing smokers and ex-smokers until you build a theory of the process — perhaps starting with curiosity, then using smoking for stress, leading to dependence, and cycles of quitting and relapse.
THEMATIC ANALYSIS
Looking for repeated ideas or “themes” across a set of data, such as interviews. This does not involve numbers.
Example (smoking): Analyse interviews and identify common themes like stress relief, peer influence, body image, and availability of cigarettes.
CONTENT ANALYSIS
Taking communication (e.g. adverts, films, interviews), coding it into categories, and counting how often each category appears. This turns words or images into numbers.
Example (smoking): Look at cigarette adverts or films and count how often smoking is shown, whether men or women are smoking, and whether it is linked to stress, glamour, or social life.
DISCOURSE ANALYSIS
Looking at how language is used to shape ideas, identity, and power. The focus is on how something is said, not just what is said.
Example (smoking): Study how people describe smoking — is it seen as a “bad habit,” a “disease,” a “rebellion,” or a “coping strategy”? What do these ways of talking reveal about stigma and responsibility?
NARRATIVE ANALYSIS
Studying the stories people tell about their lives, looking at events, turning points, and the meanings attached to them.
Example (smoking): Analyse ex-smokers’ stories about when they started, when they faced a health scare, and when they quit, showing how stopping smoking is described as a major life change.
PHENOMENOLOGICAL ANALYSIS (IPA)
Exploring what an experience feels like to the person, and the meaning they attach to it.
Example (smoking): Do detailed interviews on what it feels like to crave a cigarette, to smoke one, and to try quitting. Look for themes like craving, relief, guilt, and control.
CONTENT ANALYSIS

CONTENT ANALYSIS
AQA A-level Psychology specification (7182) Content analysis, coding and thematic analysis
KEY TERMS – CONTENT ANALYSIS
CONTENT ANALYSIS
A research method used to study communication by coding material (e.g. interviews, media, adverts) into categories and counting how often they occur.QUALITATIVE DATA
Non-numerical, descriptive information such as words, images, or open-ended answers.QUANTITATIVE DATA
Numerical information that can be measured and analysed statistically, such as frequencies or percentages.CODING
The process of assigning labels (categories) to segments of text, images, or behaviour to make the material analysable.CATEGORY
A label used in coding to represent a theme, idea, or behaviour (e.g. “Social Acceptance” as a reason for smoking).CODING FRAME
The full set of categories used in a content analysis. This acts as the complete list of labels applied to the material.CODEBOOK
The operationalised instructions for how to apply each category. It includes definitions, include/exclude rules, and example quotes, ensuring coders apply categories consistently.UNIT OF ANALYSIS
The basic element being coded, such as an entire response, a phrase, a reason clause, or a scene in a film.OPERATIONALISATION
The process of defining abstract ideas (e.g. “peer pressure”) in measurable terms so they can be reliably coded.MANIFEST CONTENT
The obvious, surface-level features of material (e.g. the number of times the word “stress” is mentioned).LATENT CONTENT
The underlying meaning or interpretation of the material (e.g. a theme of “pressure to succeed” even if the word “success” is not used).INTER-RATER RELIABILITY
The extent to which two or more coders agree when coding the same material. High agreement suggests the coding frame and codebook are clear.CONTINGENCY TABLE
A table showing how many times each category occurs, sometimes split by groups (e.g. male vs female adverts).THEMATIC ANALYSIS
A qualitative method related to content analysis, focusing on identifying and describing recurring patterns of meaning rather than counting frequencies.DISCOURSE ANALYSIS
A qualitative method focusing on how language is used to construct meaning, identity, or power relationships, rather than simply what is said.
WHAT IS CONTENT ANALYSIS?
The simplest way to explain content analysis is that it analyses the content of communication — such as interviews, newspapers, adverts, or TV. The material is coded into categories, and the frequency of each category is counted. This turns qualitative data into quantitative data. But lets go into more detail
Content analysis (also called textual analysis) is a research method used to study communication by turning qualitative material such as interviews, open-ended questionnaires, diaries, newspapers, or social media posts into data that can be analysed. The researcher looks for themes, categories, or key words within the material and then records how often they appear. This makes it a bridge between qualitative and quantitative research, because the rich detail of open responses can be summarised in numerical form (e.g. frequency counts).
Content analysis is useful because it provides a structured way of examining material that might otherwise seem too diverse or subjective to study. By coding and counting categories, psychologists can identify recurring patterns, compare how different groups communicate, and make evidence-based conclusions about the context, attitudes, or social meanings behind the communication Ole Holsti described it as a tool for making inferences about communication and its background.
Content analysis can be applied to a wide range of mediums. It can be used with written sources such as diaries, letters, essays, or newspaper articles. It is equally suited to TV shows, films, historical documents, advertisements, textbooks, and social media—essentially any form of communicative language. For instance, a straightforward content analysis might measure the screen time of male versus female actors in a TV show like EastEnders, providing insights into gender representation in media. It can also be applied to spoken material such as interview transcripts or open-ended questionnaire responses, once they are written down. Finally, it can be used with visual material such as adverts, films, photographs, or online posts, because images often contain recurring symbols or messages (for example, how often men and women are shown in stereotypical roles). What makes all of these suitable is that they contain messages that can be coded in a reliable way and then counted.
The purpose and application of content analysis go beyond simple counting. It categorises aspects of human behaviour or characteristics found in communication and quantifies these occurrences to uncover underlying patterns. Because of this, it is widely used by psychologists, sociologists, and other social scientists to examine content across many forms of media and communication. As one example, analysing newspaper headlines over time can reveal shifts in public opinion, media bias, or the evolution of language surrounding specific issues such as climate change or political movements.
The key feature that makes content analysis different from other approaches is that it focuses on the frequency of categories. For example, if students are interviewed about exam stress, a researcher might count how many times words like stress, tired, or support are used. In a different setting, a psychologist might watch television adverts and record how many times male versus female characters are placed in positions of authority. In both cases, the data ends up as numerical counts or percentages, which can then be statistically analysed or compared across groups. This combination of qualitative material and quantitative output makes content analysis a bridge between the two traditions.
To make the distinction clear, imagine one interview transcript where a student says:
“I feel stressed all the time before exams. My parents expect me to do well, and sometimes I can’t sleep because I keep worrying. Talking to friends helps, but most of the time I just push through on my own.”
Using content analysis, the researcher would count the number of times words like stress, parents, sleep, friends and worry appear, and compare frequencies across different students.
Thematic analysis focuses more on the qualitative interpretation of data, exploring themes and patterns that emerge from the material. It is flexible and adaptable to the researcher’s needs. Using thematic analysis, the same interview would be grouped into broader themes such as exam pressure, family expectations, and coping strategies. These themes would then be described across the dataset without being reduced to numbers. By contrast, content analysis is more rigid and quantitative, focusing on counting and categorising content to identify patterns or trends. Both methods have their place in research, and the choice between them depends on the aims and nature of the study.
Using discourse analysis, the researcher would focus on how the student talks about stress: whether they present it as something personal or external, whether they frame it as weakness or resilience, and what this reveals about cultural attitudes toward exams.
This single script shows the differences clearly. Content analysis reduces material to frequencies that can be compared statistically, thematic analysis draws out recurring meanings, and discourse analysis examines how language itself constructs the problem.
In summary, content analysis is a versatile and powerful research method that provides a systematic approach to understanding the content and context of communication. It offers both quantitative data and qualitative insights into human behaviour and societal trends, making it a valuable tool across the social sciences
EXAMPLES OF CONTENT ANALYSIS
Newspapers and Public Opinion: Content analysis of British newspaper headlines has shown that immigration is often framed with metaphors of threat such as “floods” and “waves”, which became more frequent in the late 20th century (Gabrielatos & Baker, 2008).
Gender Roles in Advertising: Manstead and McCulloch (1981) analysed 170 TV adverts and found women primarily depicted as product users in domestic roles, while men were more often shown as experts or authority figures.
Gender Stereotypes in Children’s Texts: Hartman and Judd (1978) analysed school reading materials and found boys were over-represented, more active, and described with adventurous adjectives, while girls were under-represented, passive, and confined to domestic contexts.
Racial Stereotypes in Media: Entman (1992) examined American news and found Black men disproportionately associated with crime stories, while White figures were more often depicted in professional or leadership roles. Similarly, Eastman & Billings (2001) found Black athletes more often coded as “naturally talented,” while White athletes were attributed “intelligence” and “hard work.”
Body Image and Weight Bias: Fouts and Burggraf (1999) analysed prime-time TV and found slim women far more likely to be portrayed as attractive and desirable, while heavier female characters were often ridiculed or shown in negative roles.
Age Stereotypes: Signorielli (2004) studied TV portrayals of older adults and found older women underrepresented compared to older men and more often coded as frail, dependent, or comic, while older men were portrayed as wise or authoritative.
Political Communication Online: Gruber (2009) analysed thousands of online comments about Sarah Palin and Hillary Clinton, finding 76% of Palin comments and 67% of Clinton comments contained sexist content, highlighting the persistence of gendered bias in political discourse.
Children’s Literature and Cultural Values: Nippold et al. (1990) compared American and Japanese children’s books, finding American texts more often coded for independence and self-achievement, while Japanese texts emphasised family duty and collective responsibility.
Media Violence: Wilson et al. (2002) coded children’s television and found that physical aggression occurred frequently (on average every nine minutes), raising concerns about exposure to violent models in early development.
Social Media and Body Ideals: Tiggemann & Slater (2014) examined Facebook use in adolescent girls and found greater exposure to appearance-related content predicted higher body dissatisfaction. More recent analyses of Instagram “fitspiration” content (Carrotte, Prichard, & Lim, 2017) showed repeated themes of thinness and dieting, reinforcing narrow appearance ideals
HOW TO ANALYSE USING CONTENT ANALYSIS
AT A GLANCE — THE 11 STEPS
DEFINE THE RESEARCH QUESTION
State clearly what you want to investigate.SELECT THE MATERIAL (AND SAMPLING)
Decide on the type of material to analyse (e.g., STUDENT QUESTIONNAIRES, INTERVIEWS, ADVERTS, NEWSPAPERS) and how it will be sampled.DECIDE ON THE UNIT OF ANALYSIS
Specify what counts as one unit of data (e.g., A WHOLE RESPONSE vs EACH REASON GIVEN).IDENTIFY INITIAL CATEGORIES
These are the smallest labels used to tag ideas in the data (e.g., SOCIAL ACCEPTANCE, STRESS).DEVELOP A CODING FRAME
This is the full set of categories you will use in the study (the complete list of labels).DESIGN A CODEBOOK
The codebook operationalises each category with:DEFINITION
INCLUDE / EXCLUDE RULES
EXAMPLE QUOTES (CODE / DON’T CODE)
NOTES ON OVERLAPS AND PRIORITY
POLICY ON SINGLE VS MULTIPLE CODING
PILOT AND REFINE
Test the coding frame on a small sample, refine definitions, and check agreement between coders.TRAIN CODERS AND CHECK RELIABILITY
Ensure coders apply the codebook consistently. Calculate inter-rater reliability (e.g., % AGREEMENT, COHEN’S KAPPA).CODE THE FULL DATASET (WITH AN AUDIT TRAIL)
Apply the final codebook to all material. Keep a record of who coded what and when.COUNT AND ANALYSE
After coding is complete, create a CONTINGENCY TABLE. This shows how often each category was used (FREQUENCIES and/or PERCENTAGES), and allows comparisons across groups (e.g., BOYS VS GIRLS). Data can then be presented in tables, graphs, or tested statistically (e.g., χ²).REPORT CLEARLY
Present the METHODS, RELIABILITY, RESULTS, EXAMPLES, and LIMITATIONS
DESIGNING FOR CONTENT ANALYSIS
STEP 1: RESEARCH QUESTION
Title: INITIATION OF SMOKING IN TEENAGERS Question: Why did teenagers start smoking?
STEP 2: MATERIAL AND SAMPLING
Decide which medium you will use, e.g., questionnaires, interviews, diaries etc.
Applied Example: Open-ended questionnaire response from male and female students (13–18) from ten independent secondary schools in South-East London.
Prompt: “Why did you start smoking?”
Ethics: anonymise responses, obtain consent, give right to withdraw.
STEP 3: DECIDE ON THE UNIT OF ANALYSIS
Specify what counts as one unit of data (e.g., A WHOLE RESPONSE vs EACH REASON GIVEN).
STEP 4: IDENTIFY INITIAL CATEGORIES
Specify the smallest labels used to tag ideas in the data (e.g., SOCIAL ACCEPTANCE, STRESS).
STEP 5: BUILD A CODING FRAME
A coding frame is the actual set of categories you are using to code the data. In other words, It’s the list of labels (e.g. Social Acceptance, Stress, Body Image Concern, Curiosity that the participants will use in their answers to the smoking initiation question. Think of it as the skeleton of the analysis.
A good coding frame is explicit, exhaustive, and usable by another coder who did not design it.
There are two methods to coming up with the categories that will form your coding frame
Top-down (deductive) coding: Start with categories suggested by theory or past research. For example, you might expect Social Acceptance or Stress to appear as reasons for smoking, because these have been identified in previous studies.
Bottom-up (inductive) coding: Read a sample of responses first and let categories emerge from what people actually say. For instance, students might mention Boredom or Curiosity, even if these were not predicted.
Hybrid approach: In practice, most content analyses use a mixture — beginning with theory-based categories, then refining or adding new ones if they appear frequently in the data.
Each category in the coding frame must then be operationalised:
STEP 6: DESIGN A CODEBOOK AND OPERATIONALISATION
In content analysis, researchers start with broad ideas categories such as peer influence or stress. But if they want to test these ideas scientifically, they need to operationalise them — that means turning the abstract concepts into clear, measurable categories that researchers can actually count.
In content analysis, operationalisation takes the form of a codebook.
A code book is the instruction manual that explains how to apply the coding frame It is the formal name for the written set of instructions that defines each category in detail. The codebook makes sure all coders understand categories in the same way and apply them consistently.
The codebook is where theory becomes measurement. Without it, coders would make personal judgements and results would be unreliable. With it, the process is systematic, replicable, and scientific.
It contains:
Category names
Operational definitions (what the category means)
Rules (what to include / exclude)
Examples of coded vs non-coded text
Notes about overlaps or priorities
Policy on single vs multiple codingIt makes the coding frame explicit, consistent, and replicable so two coders would use it the same way.
Coding involves assigning labels to segments of text that relate to your themes. For instance, In this step, you'll assign labels to specific segments of text that correspond to the themes you've identified. This involves categorising parts of the text based on their relevance to your overarching themes. And you are creating categories and subcategories from the codes to organise them hierarchically.
WHAT GOES INTO A CODEBOOK?
Each category should include:
Category name – a short label for the concept (e.g. Social Acceptance).
Operational definition – a clear description of what this category means in your study.
Include / Exclude rules – precise instructions about what counts and what does not.
Example quotes (code / don’t code) – real or plausible examples that show how to apply the category.
Notes on overlaps / priority – what to do when a response could fit more than one category.
Coding policy – whether coders can give more than one category per response (multiple coding) or must choose only one (single coding).

CODING FRAME
CORE CATEGORIES
SOCIAL ACCEPTANCE (PEER INFLUENCE) This category would include specific instances like being "forced to play ‘chew the butt’," gaining "acceptance into the cool group through smoking," or any mention of peers influencing smoking behaviours, illustrating the impact of social circles on smoking initiation.
Definition: Started to gain approval, fit in, or join a group.
Include: “Everyone at my school smoked,” “to look cool.”
Exclude: Copying what actors or strangers do (code Vicarious Reinforcement).
Example (code): “All my friends smoked; I wanted to be part of it.”
Example (don’t code): “Actors made it look relaxing” → Vicarious Reinforcement.
BODY IMAGE CONCERN (WEIGHT/LOOKS)
Definition: Started for weight control or appearance reasons.
Include: “To lose weight,” “keeps me slim.”
Exclude: General confidence or appearance without weight link.
VICARIOUS REINFORCEMENT (MODELLING)
Definition: Started after observing others being rewarded for smoking.
Include: “In films it looked relaxing,” “older kids looked confident.”
Exclude: Direct pressure from friends (code Social Acceptance).
STRESS / CHANGE OF CIRCUMSTANCE (EMOTION REGULATION)
Definition: Started to cope with stress/anxiety or life changes.
Include: “Exam stress,” “parents divorcing.”
Exclude: Continued smoking due to dependence.
OTIONAL CATEGORIES (ONLY IF THEY APPEAR)
Curiosity / Experimentation — “Just wanted to try it.”
Boredom — “Nothing else to do at lunch.”
Identity / Rebel — “To feel grown up,” “to rebel.”
Family Influence — “My parents/sibling smoked.”
Addiction / Dependence—Onset — “Tried it and got hooked quickly.”
Access / Availability — “Easy to get cigarettes.”
Other (specify) — True outliers; split later if frequent.
Ambiguous / Not codable — Too vague/off-topic.
INITIATION OF SMOKING IN TEENAGERS
“I started smoking because I moved to south London and had a posh accent, and everybody laughed at me and called me aristocrat girl. I thought that if I started smoking, people would not think I was not a ‘goody two shoes’ and was a bit hard. Also, I knew that all the cool people smoked, and I wanted to be accepted in that peer group. I was 14 at the time I started smoking. I also liked the way it looked. Some girl told me I would eat less.”

IN SUMMARY
Operationalisation = making abstract ideas measurable.
In content analysis, this is done by writing a codebook.
The codebook contains definitions, rules, and examples for every category.
This ensures that different coders will code in the same way, so the analysis is systematic and reliable.
STEP 7: PILOT CODING AND REFINEMENT
Try the coding frame on 10–20 responses with two coders.
Check disagreements and refine rules.
Calculate agreement (percentage or Cohen’s κ). Aim κ ≥ .70.
Revise and re-test if needed.
STEP 8: TRAIN CODERS (INTER-RATER RELIABILITY)
Walk through the codebook together.
Practise on fresh responses.
Double-code 10–20% of the dataset during the project to monitor reliability.
STEP 9: CODE THE FULL DATASET (AUDITABLE)
Apply the final coding frame to all responses. Record the presence (1) or absence (0) of each category for every unit of analysis. Keep an audit trail that shows who did the coding, when it was completed, and which version of the codebook was used.
STEP 10: COUNT AND ANALYSE
Add up the frequencies for each category, and calculate percentages if needed. If multiple coding is allowed, totals may exceed 100% because one response can be placed into more than one category. Results can be compared across groups (for example boys vs girls) using cross-tabulations, and a chi-square (χ²) test if this has been taught. If no group comparisons are possible, focus on the overall distribution: which categories are most common, which are least common, and what this shows about the research question. Always include short quotes alongside the numbers to keep the meaning of the original responses clear.

STEP 11: REPORT CLEARLY
Write up the research process so it is transparent. State the research question, materials, sampling method, and unit of analysis. Describe the coding frame and explain how inter-rater reliability was checked and disagreements handled. Present tables or graphs showing the frequencies and percentages for each category, supported by brief quotes. Acknowledge the limitations of the study, such as volunteer bias, the limited sample, self-report issues, or the coverage of categories. Finally, mention ethical considerations such as anonymity and informed consent
MINI WORKED EXAMPLES
“Everyone smoked at my new school and it helped with exam nerves.” → Social Acceptance + Stress
“I thought it would keep my weight down after seeing models in films smoke.” → Body Image Concern + Vicarious Reinforcement
“Bored at lunch; friends smoked outside.” → Boredom + Social Acceptance
QUICK CHECKLIST
Research question ✅
Material and sampling ✅
Unit of analysis ✅
Coding frame with definitions + rules ✅
Pilot + reliability ✅
Training + checks ✅
Full coding + audit trail ✅
Frequencies + comparisons + quotes ✅
Clear report + limitations + ethics ✅
EXERCISE: CONTENT ANALYSIS OF PERSONAL ADS INTRODUCTORY LEVEL
You are going to carry out a mini content analysis of dating adverts. The aim is to practise the steps of the method.
MINI STUDY : ANALYSIS OF LONELY-HEARTS ADVERTS
Evolutionary psychologists propose that men and women seek different things in a partner because of the basic differences and each is at a high physical cost. In addition, women have to spend time after giving birth feeding a child. Therefore, a woman will enhance her reproductive success by finding a male partner who has 'resources' (such as being wealthy or having property).
Men produce millions of sperm and so could potentially father millions of children. Their reproductive success will be maximised by finding a fertile partner. One way to ensure this is to find a young partner (younger women are more fertile). Signs of youthfulness include glossy abundant hair, slim waist, and symmetrical face (which are all ingredients of physical attractiveness).
This led Robin Dunbar to predict that men and women would seek different things in a partner and also advertise different things. In lonely hearts ads women should seek resources and advertise attractiveness and men should do the opposite.
David Waynforth and Robin Dunbar (1995) analysed nearly 900 ads from 400 American newspapers and found support for this.
You can read more about Dunbar's research at http://www.bbc.co.uk/science/humanbody/mind/articles/emotions/lonelyhearts.shtml
TO REPLICATE THE STUDY
TITLE: SEXUAL SELECTION AND DATING ADVERTISEMENT
AIM AND HYPOTHESIS “Evolutionary psychologists believe that sexual selection is different between the sexes. Males advertise status, and females analyse looks.
To test this hypothesis, conduct a content analysis of dating adverts in newspapers.
1. Look through the lonely heart adverts below and write down the sorts of things men and women say about themselves.
2. Use this information to decide to decide on a list of behavioural categories to use when doing your content analysis , this is your coding frame.
3. Use your behaviour coding frame to record the contents of male adverts . for each advert tick every category that has been included.
4. Then do the same for female adverts
5. Finally, place these into one of four categories
· Advertise resources.
· Advertise personality.
· Advertise looks.
· Advertise hobbies.
6. Represent your findings in a bar chart
DATASET (30 SAMPLE ADVERTS)
Pretty brunette, 20, would like to meet a man with a good job.Pretty brunette, 20, slim and sociable, enjoys clubs, fashion, and nights out.
Curvy blonde, bubbly personality, confident, loves dancing, cocktails, and laughter.
Voluptuous redhead, 25, romantic, porcelain skin, loves theatre and fine dining.
Petite student, 19, adventurous, loves festivals, camping, and late nights.
Blonde, 23, stylish and ambitious, junior lawyer, enjoys travel and good wine.
Brunette, 21, glamorous and flirty, loves city nightlife and live music.
Slim blonde, 20, keeps fit, into yoga and gym, fun-loving and outgoing.
Redhead, 22, elegant, tall, enjoys art galleries, concerts, and weekends away.
Brunette, 27, PhD student in biology, bookish but sociable, enjoys hiking.
Widow, 55, witty, warm, good sense of humour, enjoys conversation and gardening.
Glamorous blonde, 26, bubbly, loves fashion, shopping, and cocktails with friends.
Slim brunette, 25, sporty, plays hockey, sociable and ambitious.
Redhead, 28, striking smile, confident, into jazz clubs and wine bars.
Petite blonde, 23, adventurous, loves backpacking and surfing.
Brunette, 30, independent, works in finance, confident, loves city breaks.
Professional male, 42, intelligent, witty, financially secure, loves travel.
Male, 47, cuddly, big fan of food, wine, and stand-up comedy.
Tall male, 35, ambitious, dependable, senior executive, enjoys sailing.
Businessman, 50, wealthy, stylish dresser, confident, loves fine dining.
Male, 30, shy, thoughtful, enjoys films, books, and quiet nights.
Sociable male, 55, relaxed, enjoys golf, cruises, and world travel.
Male, 28, sporty, competitive, loves marathons, gym, and rugby.
Male, 40, dependable, witty, manager, enjoys theatre and good restaurants.
Entrepreneur, 33, ambitious, outgoing, expanding business, enjoys networking.
Male, 29, slim, dark-haired, loves indie music and art festivals.
Male, 38, confident, witty, enjoys hiking, wine, and countryside pubs.
Male, 45, humorous, successful, loves opera, city dining, and museums.
Male, 32, thoughtful, academic, enjoys reading, philosophy, and quiet cafes.
Male, 41, owns property, financially secure, enjoys luxury travel.
Male, 36, ambitious, dependable, enjoys gym, restaurants, and weekends away
Useful Abbreviations:
ND - Non-Drinker
OHAC - Own house and car
TLC - Tender loving care
NS - Non-smoker
YO - Years old
OFAC - Own flat and car
WLTM - Would like to meet
GSOH - Good sense of humour
Clichés are an integral part of lonely heart adverts, and the abbreviations above have been used because they represent clichéd phrases. The verbs used most often are "seeks", "would like to ..." and "looking for". "Seeks" would be an archaism elsewhere but is present in up to half of these advertisements
A lot of euphemisms are used. Possible relationship" and "long-term relationship" suggest something more substantial than "friendship".“Sexual hints may lie in "for fun with a future", "seeks sensuous man", "open-minded female", "warm and passionate female”, “playmate and lover", or "snuggles".Euphemisms are also used for size - so instead of being "fat", people describe themselves as "curvaceous", "voluptuous", "well-built", "cuddly", or even "chubby". Small is "petite."
TASKS (ADVANCED LEVEL)
STEP 1: RESEARCH QUESTION
What differences are there between male and female personal adverts in the way people describe themselves?
STEP 2: HYPOTHESIS
Male adverts will mention status/resources (e.g. job, income, property, ambition) more often.
Female adverts will mention physical appearance (e.g. slim, pretty, tall, blonde) more often.
KEYWORDS
CATEGORY
A single label that represents one idea or theme in the data.
The smallest unit in this system.
Example: Social Acceptance (smoking to fit in).
CODING FRAME
The whole set of categories you are using in a study.
Basically, a list of all the labels that capture the reasons or themes.
Example (smoking initiation):
Social Acceptance
Stress / Coping
Body Image Concern
Curiosity / Experimentation
Family Influence
CODEBOOK
The detailed manual that explains how to use the coding frame.
It takes each category from the coding frame and operationalises it:
Category name
Definition
Rules (what to include/exclude)
Example quotes (code / don’t code)
Notes on overlaps and coding policies
Example (entry from the smoking study codebook)
STEP 3: UNIT OF ANALYSIS
For this exercise, treat each advert as one response.
Example: If an advert says “Pretty blonde, loves dancing, works as a lawyer,” the whole advert is treated as one unit. You would tick all the categories that appear (Appearance, Hobbies, Status).
(Optional extension for advanced students: You could split adverts into two parts — how the person describes themselves vs what they say they want in a partner. But for now, keep it simple and code each advert as one response.)
STEP 4–6: BUILD CATEGORIES AND A CODING FRAME
Scan the adverts. Read through all of them and make notes on the ideas that keep appearing.
Create categories. Turn those recurring ideas into short labels.
Build your coding frame. This is your complete list of categories that you will use when coding the adverts.
Add examples. For each category, write down one or two phrases from the adverts that fit into it

STEP 7–10: CODING AND ANALYSIS
Code all adverts using the categories.
Make a contingency table comparing how often each category appears in male vs female adverts.Count the frequency of codes to quantify the presence of each theme,
Review the data again, using your coding frame to identify instances of each theme.
For example: How many female adverts mention Appearance vs how many male adverts?
Compare patterns to see whether they support the hypothesis
ANSWERS
STEP 4–6: BUILD CATEGORIES AND A CODING FRAME
MAKE A CODEBOOK AND CODING FRAME
STATUS: Any mention of the participant's relative social or professional position or standing.
APPEARANCE. Any mention of physical appearance.
PERSONALITY: Any mention of personality, character, disposition, make-up, behaviour, nature, temperament, mood, emotion, or spirit.
HOBBIES: Any mention of an interest or hobby, pastime, diversion, leisure pursuit,
OPERATIONALISING THEMES
Operationalising these themes involves identifying and coding specific instances within the data that correspond to the defined criteria for each theme. This detailed approach allows researchers to systematically categorize qualitative data, facilitating deeper analysis and interpretation of the underlying patterns and insights within the dataset.
STATUS: DEFINITION: References to any aspect that signifies the participant's social or professional hierarchy, achievements, or rank. This includes job titles, educational attainment, economic bracket, social class indicators, or any mentions reflecting the individual's standing within a professional or social context.
OPERATIONALISING: Code for explicit mentions of job positions (e.g., "manager," "teacher"), educational degrees (e.g., "PhD holder"), social class indicators (e.g., "middle-class family"), or any descriptors that denote professional or social ranking.
APPEARANCE: DEFINITION Captures all references to an individual's physical traits, including but not limited to body shape, facial features, hair texture and colour, height, weight, and overall attractiveness or any specific physical attributes mentioned.
OPERATIONALISING: Code for direct descriptions of physical traits (e.g., "tall," "blonde hair"), comparative attractiveness statements (e.g., "good-looking"), or any subjective or objective mentions of physical appearance.
PERSONALITY: DEFINITION Encompasses mentions of character traits, emotional dispositions, habitual behaviours, and overarching temperament. This theme includes how individuals describe their or others' personalities, characterizing nature, mood, emotional responses, or spirit.
OPERATIONALISING Code for explicit personality trait descriptors (e.g., "introverted," "optimistic"), behaviour patterns (e.g., "tends to help others"), mood tendencies (e.g., "usually cheerful"), or general character assessments (e.g., "has a kind nature").
HOBBIES: DEFINITION: Involves mentions of activities or interests pursued for relaxation or pleasure outside of one's professional obligations. This includes pastimes, leisure activities, sports, creative endeavours, or any recreational pursuit mentioned.
OPERATIONALISING Code for specific hobbies or interests (e.g., "playing chess," "gardening"), descriptions of leisure activities (e.g., "going hiking on weekends"), or any mentions of how individuals spend their free time engaging in particular pursuits.
List synonymous words or related concepts that should be grouped to simplify the analysis
Appearance: Words or expressions synonymous with physical appearance, e.g., any positive mention of hair- type colour, texture, appearance; body shape; eyes- shape, size, colour, etc.; face, facial features, attractiveness, height, weight, strength, skin texture, age, length of legs, size of breasts, hips, bottom, waist, muscles, tone of muscles, six pack, absence of lines etc. Words synonymous with attractive, e.g., beautiful, lovely, stunning, busty, voluptuous, slender, skinny, athletic, classical, good-looking, striking, cute, handsome, pretty, attractive, sexy, buff, curvy, shapely, angelic-looking, bang-tidy, gorgeous, eye-catching.
Status: words or expressions synonymous with status, e.g., rank, prominence, prestige, accomplishments, conquests, position, successes, social standing, class, caste, social group, social order, background, notoriety, fame, belongings, properties, businesses, companies, financial interests, shares, possessions, job, profession, vocations, career, connections, memberships, professional bodies, location, car, house, qualifications, income, spending habits. Words synonymous with status, e.g., rich, wealthy, prosperous, affluent, loaded, well-off, solvent, flush, well-heeled, well-to-do, successful, thriving, monied, up and coming.
Personality: words or expressions synonymous with personality, e.g., happy, sad, kind, thoughtful, funny, serious, bubbly, adventurous, shy,
Hobbies: words or expressions synonymous with having a hobby, e.g., knitting, golf, cinema, theatre, dance, drinking, keeping fit, pubs, shopping, gardening, chess, backgammon, debating, watching soaps, concerts, travelling, skiing, skating, skateboarding, dining out, museums, stamp collecting, Morris dancing, cricket, rugby, darts, music, concerts, festivals, raves, S&M, comedy, sewing, pottery, animals, horse riding, reading, writing, computer games.
STEP 7–10: CODING AND ANALYSIS

ANALYSIS: By analysing the contingency table, researchers can identify patterns in preferences across different categories, such as whether certain personality traits are more sought after in male-seeking-female advertisements than female-seeking-male or how hobbies impact attractiveness in the context of sexual preferences.
ADVANTAGES OF CONTENT ANALYSIS
SYSTEMATIC AND OBJECTIVE
Content analysis imposes structure on messy qualitative material. Researchers decide categories in advance, and each piece of data is coded consistently.
This reduces bias compared to methods that rely purely on personal interpretation.
Example: Instead of relying on a subjective impression that “girls in adverts seem to talk more about looks,” the researcher can count frequencies and show numerically that 65% of female adverts mention appearance compared with 20% of male adverts.
REPRODUCIBILITY AND RELIABILITY
Because the coding frame and codebook are written down in detail, another researcher can replicate the same procedure with the same data.
Inter-rater reliability (two coders producing the same results) can be checked statistically (e.g. Cohen’s kappa). This improves confidence in the findings.
Example: Two independent coders both record “stress” and “peer influence” as categories in 80% of the same responses — showing that the method is reliable.
ABILITY TO HANDLE LARGE DATASETS
Content analysis works well with large volumes of text, images, or transcripts. Once categories are set, the coding can be applied quickly and consistently.
This makes it useful for longitudinal (over time) or cross-cultural studies, where thousands of items can be analysed systematically.
Example: Researchers can analyse 50 years of political speeches to track how often terms like “freedom,” “security,” or “equality” are used.
FLEXIBILITY OF MATERIAL
Almost any form of communication can be analysed: written documents, interview transcripts, TV adverts, photographs, social media posts.
This makes content analysis highly adaptable and applicable across many areas of psychology, sociology, media, and history.
Example: Analysing Instagram posts for themes of body image; or examining 19th-century diaries for references to mental health.
BRIDGE BETWEEN QUALITATIVE AND QUANTITATIVE
Content analysis starts with qualitative material (open-ended responses, narratives, images) and produces quantitative results (counts, percentages).
This means it can combine the richness of qualitative data with the rigour of quantitative analysis.
Example: “Why do you smoke?” → open-ended responses → categories (stress, peers, weight) → numerical results that can be statistically compared across groups.
ETHICAL AND NON-INTRUSIVE
Often relies on existing material (e.g. adverts, newspapers, online content), which means participants don’t need to be directly involved.
Reduces ethical risks compared with experimental methods.
Example: Analysing school textbooks for gender bias without involving children directly.
DISADVANTAGES OF CONTENT ANALYSIS
POTENTIAL FOR OVERSIMPLIFICATION
Because the method focuses on counting words, themes, or categories, it can strip away the richness of the original material.
Important nuances, tone, or emotional depth may be lost once data is reduced to numbers.
Example: Coding the phrase “I smoked because my parents split up and I was lonely” simply as “Stress” may miss the deeper meaning about family breakdown and emotional wellbeing.
LIMITED BY PREDEFINED CATEGORIES
Researchers must decide their categories in advance. This makes the method more systematic, but it also risks missing unexpected or new themes that appear in the data.
If participants describe something that doesn’t fit, it may be forced into “Other,” which weakens the value of the analysis.
Example: If students often wrote “I smoked because cigarettes were cheap in my country,” but “Cost” wasn’t in the original coding frame, that theme could be overlooked.
CONTEXTUAL AND INTERPRETIVE LIMITATIONS
Content analysis mainly deals with manifest content (what is directly said or written). It is less good at picking up latent content (the underlying meanings or cultural messages behind the words).
Example: Counting how often the word “boss” appears in adverts tells us little about whether the role is being portrayed positively or negatively.
TRANSFORMING QUALITATIVE INTO QUANTITATIVE DATA
Content analysis turns descriptive, open-ended responses into numerical codes. While this makes comparison possible, it also changes the nature of the data.
What started as rich, qualitative material becomes simplified into frequencies and percentages. This can reduce validity if the categories don’t fully reflect the participant’s meaning.
Example: “I smoked because I was stressed, bored, and wanted to fit in” becomes three tick-boxes — Stress, Boredom, Social Acceptance — and the personal story is lost
WHERE DOES NVIVO FIT?
NVivo is specialist software designed to support qualitative data analysis, including content analysis.
It helps researchers organise, code, and search large amounts of text, audio, video, or image data.
With NVivo you can:
Upload datasets (e.g. interview transcripts, PDFs, social media posts).
Highlight and tag sections of text with your chosen categories.
Automatically search for word frequencies or patterns.
Generate visualisations such as word clouds, charts, and coding matrices.
Compare coding between researchers to check inter-rater reliability.
This makes it much faster and more manageable to apply content analysis to big datasets.
However, NVivo is a tool, not a method: the researcher still has to design the categories, codebook, and rules. The software only applies and organises them more efficiently.
Example in context:
If students designed categories for “dating adverts” (Appearance, Status, Hobbies), NVivo could:
Auto-count how often each word appears (e.g. “slim,” “wealthy,” “fun”).
Group synonyms under one category.
Produce a contingency table comparing male vs female adverts instantly
ASSESSMENT FOR CONTENT ANALYSIS
CONTENT ANALYSIS – AQA EXAM FOCUS
In AQA exams, content analysis is usually tested through short-answer questions (2–4 marks). You don’t need to write an essay — the key is to show you understand the process and can apply it.
AO1 – KNOWLEDGE (2 MARKS)
Typical questions:
What is content analysis?
What is meant by coding in content analysis?
What is a coding frame?
👉 Be ready with a clear, simple definition: coding qualitative material (e.g. interviews, diaries, adverts) into categories and counting how often they appear.
AO2 – APPLICATION (4 MARKS)
These questions give you a short research scenario and ask how content analysis could be carried out.
Examples:
Explain how psychologists could use content analysis to analyse film clips of drivers.
How could researchers analyse newspaper articles about mental health using content analysis?
A psychologist interviews teenagers about smoking. Explain how the data could be analysed using content analysis.
Sometimes you might be given a short extract and asked to code it into categories.
Example:
“I smoked because my friends did and it helped with stress.”
Answer: categories = Social Acceptance and Stress.
AO3 – EVALUATION (4–6 MARKS)
You’ll usually be asked for one strength and one limitation.
Strengths: systematic and objective, can handle large datasets, produces quantitative data from qualitative sources.
Limitations: oversimplifies complex meanings, observer bias (coders may disagree), loss of context when reducing data to categories.
WHAT TO EXPECT
Most questions are 2–4 marks.
AO1 = definitions.
AO2 = applying the coding process to a short study or extract.
AO3 = one strength and one limitatio
TYPICAL QUESTIONS
In an observational study,100 cars were fitted with video cameras to record the driver’s behaviour. Two psychologists analysed the data from the films using content analysis. They found that 75% of accidents involved a lack of attention by the driver. The most common distractions were using a hands-free phone or talking to a passenger. Other distractions included looking at the scenery, smoking, eating, personal grooming, and trying to reach something within the car.
What is content analysis? 2 marks
Explain how the psychologists might have conducted content analysis to analyse the film clips of driver behaviour. 4 marks.
Please explain how the two psychologists might have assessed the reliability of their content analysis. Four marks
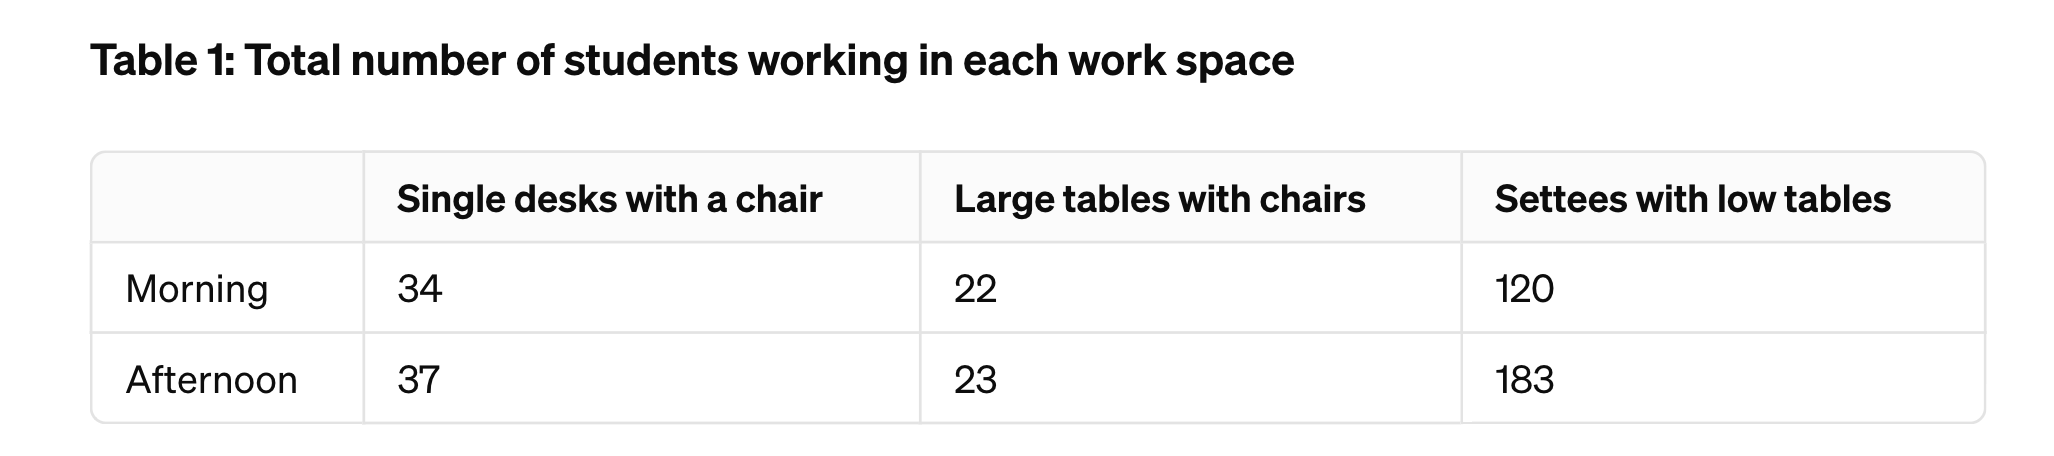
Researchers wanted to see if there was a difference in the number of students choosing to use various workspaces in the college library. Previous research findings on this topic were inconsistent.
There were three types of workspace available in the library:
SINGLE DESKS WITH CHAIRS LARGE TABLES WITH CHAIRS SETTEES WITH LOW TABLES
The researchers used CCTV camera recordings of the different workspace areas over three days. Each day, they analysed two hours’ worth of recordings from the morning and two hours’ worth from the afternoon. They noted the number of students seen working at each of the three workspaces.
THE RESULTS OF THE LIBRARY STUDY ARE SHOWN BELOW
Question 4 on a questionnaire was ‘Which of the following work spaces do you use most often in the library?’
THE RESULTS FOR QUESTION 4 ARE SHOWN IN TABLE 3 BELOW

.
4. Compare the results in Table 2 with those in Table 3. What conclusion could now be made from these two sets of data? Explain your answer. 4 MARKS
5. Explain in what way a content analysis is a form of observation.
6. How might observer bias the findings of a content analysis?
7. A university department was given funding to investigate the stereotypes presented in children's TV regarding age stereotypes, gender stereotypes, etc.
a. Suggest three items that could be used as behavioural categories in this study.
b. Write operationalised definitions for these items.
c. Explain how you would do this as a quantitative content analysis.
d. Identify one issue of reliability in this research and describe how you could deal with this issue of reliability.
e. Identify one issue of validity in this research and describe how you could deal with this issue of validity.
f. Explain how you would do this as a qualitative content analysis.
8. A psychology student is interested in the effects of historical periods on the way people express themselves in songs. She decides to compare songs of the 1950s with those of the 1970s to consider the differences in the lyrics before and after the social revolution of the 1960s.
a. Develop a suitable coding system to analyse the content of songs. The categories you select should be relevant to the issue of historical periods.
b. Consider how you might use this content analysis to compare songs from the two different periods.
c. Explain how you could measure the dependent variable using a content analysis.
d. Develop a suitable coding system for your content analysis.
9. One study (Solley and Haigh, 1957) found that children draw more complex pictures of Santa before Christmas than afterwards.
a. Develop a suitable coding system to analyse the content of the pictures. The categories you select should be relevant to the issue of classifying different drawings of Santa.
b. Consider how you might use this content analysis to compare the drawings of Santa.
ANSWERS
Q1. What is content analysis? (2 marks)
Content analysis is a research method used to study behaviour indirectly by examining material such as films, transcripts, adverts or articles. It involves coding this material into categories and then counting the frequency of these categories, producing quantitative data that can be analysed.
Q2. Explain how the psychologists might have conducted content analysis to analyse the film clips of driver behaviour. (4 marks)
The psychologists would first decide on a set of categories to represent different distractions (e.g. phone use, talking to a passenger, grooming, eating). They would then watch the film clips and use a coding system to record whenever each category of distraction occurred. Each instance would be tallied, creating frequency counts. This allowed them to calculate percentages, such as 75% of accidents involving inattention, and identify which distractions were most common.
Q3. Please explain how the two psychologists might have assessed the reliability of their content analysis. (4 marks)
Reliability could be checked through inter-rater reliability. Both psychologists would code the same set of film clips independently using the same categories. Their coding would then be compared, and the level of agreement calculated (e.g. by percentage agreement or using a statistical test such as Cohen’s kappa). If agreement was high, this would show that the coding system was clear and reliable. If agreement was low, the coding frame would need refining.
Q4. Library workspace study – Compare the results in Table 2 with those in Table 3. What conclusion could be made? (4 marks)
Observation data (Table 1) shows that most students were actually seen using the settees with low tables, especially in the afternoon.
Self-report data (Table 2) shows that most students said they used single desks with chairs most often.
This suggests a discrepancy between observed behaviour and self-reported behaviour.
One conclusion is that students may prefer to present themselves as using the “serious” desks, but in practice they often work in the more comfortable settee areas.
Q5. Explain in what way a content analysis is a form of observation.
Content analysis is like observation because the researcher is systematically recording behaviours or themes, but instead of watching people in real time, they observe material that has already been produced (e.g. TV, adverts, interviews). It is an indirect observation carried out on secondary data.
Q6. How might observer bias the findings of a content analysis?
Observer bias occurs when researchers’ expectations or personal views influence how they code the data. For example, a researcher who believes adverts are sexist may be more likely to notice and record stereotypical portrayals of women. This bias could distort the results.
7. Children’s TV stereotypes study
a. Three behavioural categories
Occupational role – whether characters are shown in jobs/professions.
Activity type – whether characters are shown in active/adventurous roles or passive/domestic roles.
Authority status – whether characters give orders/make decisions versus following others.
b. Operationalised definitions
Occupational role: record if a character is explicitly shown doing a job (e.g. teacher, doctor, firefighter). Do not include hobbies.
Activity type: code as “active” if a character is physically adventurous (running, fighting, exploring), “passive” if mainly shown watching, waiting, or doing domestic chores.
Authority status: code as “high” if the character makes decisions, instructs others, or solves problems; “low” if they follow instructions or are dependent.
c. Quantitative content analysis
Record frequencies of each category across a sample of children’s programmes. For example, count how many male versus female characters are shown in high authority roles. Data can then be presented as percentages and compared statistically.
d. Reliability issue
Different coders may interpret the categories differently. Solution: create a detailed coding manual with clear definitions and test inter-rater reliability by having two coders analyse the same material and calculating agreement (e.g. Cohen’s kappa).
e. Validity issue
Coding may oversimplify complex behaviour. For instance, a female character may be both adventurous and domestic. To improve validity, allow multiple coding per character or include qualitative notes alongside the frequencies.
f. Qualitative content analysis
Instead of counting, researchers would interpret themes in depth — for example, analysing how gender roles are represented and what meanings they convey. This could involve describing storylines, language used, and implicit messages about age and gender.
Q8. Songs of the 1950s vs 1970s
a. Coding system (categories relevant to historical change)
Romantic/idealised love – focus on traditional courtship and fidelity.
Social protest/activism – references to civil rights, anti-war, feminism.
Freedom/individualism – lyrics about independence, rebellion, personal choice.
Gender roles – portrayals of men and women in traditional vs non-traditional ways.
b. Comparing songs
Code a sample of songs from each decade and calculate the percentage of songs containing each category. Compare frequencies across decades (e.g. more protest/individualism themes in 1970s vs more romantic themes in 1950s).
c. Measuring the DV
The dependent variable could be the frequency of each theme per decade. This is measured by coding the lyrics into the agreed categories and then counting how often each occurs.
d. Coding system (restated operationalised)
Romantic/idealised love: references to marriage, long-term devotion. Exclude casual dating.
Social protest: explicit references to war, politics, or equality movements. Exclude personal relationship conflict.
Freedom/individualism: lyrics emphasising choice, breaking rules, personal freedom.
Gender roles: lyrics reinforcing or challenging stereotypes (e.g. women as housewives vs independent workers).
Q9. Drawings of Santa (Solley & Haigh, 1957)
a. Coding system
Detail level – number of features included (e.g. hat, beard, sack, reindeer).
Size/proportion – full figure vs partial (e.g. just head).
Complexity – use of colour, shading, background detail.
b. How to compare
Code drawings collected before and after Christmas and compare mean number of features, detail levels, and complexity. For example, more detailed Santas may be drawn before Christmas due to excitement, with simpler ones afterwards
OTHER RESEARCH METHODS THAT USE QUALITATIVE DATA FREQUENTLY
DISCOURSE ANALYSIS
Focus: Discourse Analysis investigates the use of language in texts or spoken communication within its social context. It examines how language constructs social realities, identities, and power relations. It’s not just about what is being said but how it’s being said and the implications thereof.
Methodology: It involves a detailed and nuanced examination of how language functions in various contexts. This includes looking at word choice, grammar, rhetoric, the structure of arguments, and how language is used to construct meaning and enact social practices.
Analytical Depth: Discourse Analysis tends to be more interpretative, aiming to uncover underlying meanings, societal norms, and power structures that are reflected and reproduced through language.
Data: Can include a wide range of textual and spoken materials, such as speeches, interviews, conversations, social media posts, and other forms of media
THEMATIC ANALYSIS
Focus: Thematic Analysis primarily identifies, analyses, and reports patterns (themes) within data. It emphasizes the qualitative aspects of data and seeks to uncover underlying ideas, assumptions, and conceptualisations. . It's particularly valued for its ability to uncover patterns (themes) within data, making it one of the most widely used analysis techniques in qualitative studies.
Methodology: This analysis involves carefully reading and re-reading data to identify recurring patterns or themes that are important or interesting. These themes are then closely analysed and related to the research questions. Thematic Analysis is flexible in that it doesn’t require the researcher to adhere to a predetermined framework or theory; themes can emerge from the data inductively, or the analysis can be guided by theoretical or analytical interest. For instance, in a study about smoking initiation, qualitative responses might uncover a range of complex reasons behind the behaviour, such as a desire to rebel against authority figures like parents or teachers—insights that a limited set of quantitative options might fail to capture. This capacity to reveal a broader spectrum of motivations and behaviours exemplifies why qualitative methods are valued for their depth and authenticity. It offers a more accurate reflection of participants' true experiences and feelings.
Discovering themes: A theme in thematic analysis represents a pattern within the data set, such as a topic or concept that recurs throughout the data. Themes are developed by grouping related codes. This process helps summarise large data sections meaningfully, answering research questions and fulfilling the study's aims and objectives.
Examples of Themes: These can be applied to various data types, including interview transcripts, survey responses, texts, and media. In research on drug addiction, themes might include “How drugs are obtained,” “Withdrawal,” and “Being arrested.” These themes offer a structured way to explore the narratives within the data, revealing participants' shared experiences and perceptions
Themes to Codes: A critical step in thematic analysis is coding, which involves assigning labels to text segments to organize data systematically. These labels, or codes, summarise key concepts, themes, and issues in the data set. Coding is not about creating software code but rather about segmenting the data into manageable parts, each labelled with a code that encapsulates its essence. For instance, the sentence “My teacher is a psychopath” might be coded under "teacher" or "psychopath," highlighting the concepts for further analysis
Flexibility of Thematic Analysis: The adaptability of thematic analysis makes it suitable for various research designs and questions. It can reveal the shared data's overarching categories, providing a rich, detailed, and complex data account.
DOING YOUR THEMATIC ANALYSIS
READ THE EXTRACT BELOW
“I don’t know why I started smoking really. Perhaps it is in my genes. My Mum and Dad smoked, plus all my grandparents did. Everybody smoked in the house, so maybe the passive smoking did something to my brain receptors - although, to be fair, the addiction could have started when I was in the womb as my Mum smoked throughout her pregnancy and through breastfeeding, too.
Most of my peers smoked from about the age of 13. I was forced to play ‘chew the butt’ on the way to school on the train. Later, I wanted to be accepted into the cool group at school, so I took up smoking voluntarily. I also was a bit chubby, so smoking made me eat less. I had access to lots of money so that I could get cigarettes regularly. Buying cigarettes was easy as there were no legal restrictions on the age to buy during the 1970s. Also, nobody ever got into trouble for smoking, not at school, home, or within my circle of friends.”
How would you analyse the extract?
What would be your first step in deciphering meaning?
HOW TO ANALYSE THEMATIC ANALYSIS
STEP 1: Reading and Familiarisation: Start by reading an extract multiple times to become familiar with the content, paying close attention to recurring ideas or concepts. This helps in identifying potential themes.
STEP 2: Find themes:
Social Acceptance: Seeking approval or inclusion in a desired social group.
Body Image Concern: Engaging in behaviours influenced by perceptions of one’s body image.
Vicarious Reinforcement: Learning behaviors by observing outcomes of others' actions.
Stress—Change of Circumstance: Adapting behaviours in response to new or stressful environments.
STEP 3: Make a coding frame with your discovered themes - e.g., list all key themes and their definitions. This frame serves as a guide for systematically analysing the rest of your data.
STEP 4: IDENTIFY ALL THE THEMES:
Examples
Main Theme
Theme (Category): Vicarious reinforcement from parents and peers.
Sub-themes: "Family Influence" and "Peer Influence" are sub-components of the broader theme.
Sub-themes: "Smoking for weight loss - image and operant conditioning.
Sub-themes: Smoking to look cool - operant conditioning.
Narrow some categories: For example:, Vicarious reinforcement from peers has sub categories: Role models, cultural context and the laws surrounding access to cigarettes."
CODE ALL THE THEMES:
Hierarchical Coding: Create categories and subcategories from the codes to organise them hierarchically. Synonymous words or related concepts should be grouped to simplify the analysis. For example, a Class of drugs, e.g., Opiates, which could include heroin, oxycontin, and others.
STEP 5: OPERATIONALISE THEMES AND IDENTIFY SYNONYMOUS WORDS. Lists or related concepts. These should be grouped to simplify the analysis.
Operationalise the identified themes by defining them clearly.
STEP 6: ANALYSIS: WHAT DOES IT ALL MEAN?
Remember: Although the process begins with research questions, it’s important to remember that they are not necessarily fixed. Revise definitions.
MORE EXAMPLES:
STEP 1: Reading and Familiarisation: Start by reading an extract multiple times to become familiar with the content, paying close attention to recurring ideas or concepts. This helps in identifying potential themes.
STEP 2: Find themes:
STEP 3: Make a coding frame with the themes you have discovered
STEP 4: Code and Identify all of the themes:
STEP 5: Operationalise themes and list synonymous words or related concepts that should be grouped to simplify the analysis
Operationalise the identified themes by defining them clearly. For example:
STEP 6: ANALYSIS: WHAT DOES IT ALL MEAN? Although the process begins with research questions, it’s important to remember that they are not necessarily fixed. Revise definitions.
EXERCISE ONE: SEXIST PRESCHOOL BOOKS
Social psychologists believe that educational material, such as reading books and textbooks, is sexist. They decided to analyse the content of primary school texts. Create a coding frame about sexual stereotypes and then count the frequencies of these gender stereotypes.
“John slapped Katie hard across her face. The pain shocked Katie to such a degree she immediately cowered in case of another assault. Tears slid down her face in big drops. John just laughed. As snot dripped down her chin, John turned in disgust and left the room. She was utterly devastated. She crept upstairs and hid in the study. She couldn’t tell Mother what John had done as Mother was very cross with Katie anyway; she had not done her chores that day. The floor was still upswept, and the dishes from breakfast were still left in the sink. In any case, John could do no wrong; he was going to grammar school the following year, and his mother was so proud. Katie hadn’t even been allowed to take the eleven-plus. She had wanted to persuade Mother to allow her to take it, but she was scared of her reaction. Father said girls didn’t need an education.
Katie wished for the zillionth time that she had been born a boy. Then she wiped her eyes, went downstairs and began sweeping the floor. John barely glimpsed up as she passed him by with the broom but spitefully put his foot out so she tripped and fell over, upsetting all the dust she had gathered. “What a clumsy and stupid girl you are!” shouted Father from the other side of the room. John glanced slyly at Katie out of the corner of his eye and smirked. Katie ran out of the room sobbing loudly.”
ANSWERS:
STEP 2: Find themes that relate to gender stereotypes
Gender roles and expectations
Emotional expression
Household responsibilities
Educational aspirations
STEP 6: ANALYSIS
The coding and frequency count reveals a pronounced depiction of traditional gender stereotypes in the narrative:
Gender Roles and Expectations: The narrative explicitly emphasises traditional gender roles, with John portrayed as dominant and Katie as submissive.
Emotional Expression: Katie's emotional vulnerability contrasts with John's disregard, reinforcing stereotypes of female emotional openness and male stoicism.
Household Responsibilities: Katie is depicted as responsible for domestic chores, while John's actions are not associated with household responsibilities.
Educational Aspirations and Limitations: The text delineates educational opportunities along gender lines, favouring John over Katie.
Physical Interactions and Violence: Physical violence is portrayed as an acceptable form of male behaviour towards females, further entrenching the stereotype of male dominance and female victimization.
This analysis underscores the presence of gender stereotypes in the educational material, potentially influencing children's perceptions of gender roles and expectations. The coding frame and frequency count are tools for systematically identifying and quantifying these stereotypes within the content.
SCENARIO THREE: OBESITY CAUSES
STEP 1: Reading and Familiarisation:
STEP 2: Find themes:
STEP 3: Make a coding frame with the themes you have discovered
STEP 4: Code and Identify all of the themes:
STEP 5: Operationalise themes and list synonymous words or related concepts that should be grouped to simplify the analysis
STEP 6: ANALYSIS: WHAT DOES IT ALL MEAN?
Remember: Although the process begins with research questions, they are not necessarily fixed. Revise definitions.
Psychotherapists were interested in investigating the reasons for obesity. They interviewed overweight participants. Below is an extract from an interview.
Interview extract “Why I am fat.”
“As far as I can remember, I began to overeat compulsively in year seven. It was a tough time for me (as it is for most girls) - physical development, social isolation, and emotional imbalance. At this time, I began to look to my mother for guidance, but she was so wrapped up in her problems that she had little or nothing to give --- except her example. Aside from being an alcoholic, she was a compulsive overeater herself, retreating into the bedroom after her nightly fights with my father to eat and read romance novels. And eat she did. Two bags of Sour Cream and Onion potato crisps, 2 litres of Coke, and maybe a box of biscuits, all in one sitting. I began to eat for comfort then and gained weight as I was developing a woman's body. The taunts from my classmates at being slightly chubby led me to eat even more and grow fatter. I think at this time, I might have broken the growing dependency, but in year eight, my self-loathing increased a thousand-fold when my brother physically abused me. And so the cycle increased - food comforted me.
Around this time, I remember my Dad saying something about my weight gain. "You don't want to be like your mother, do you?" (With all the disgust he felt for her evident in his tone). I, too, shared his hatred of her size, moods and eating habits; being compared to her by him only made me feel worse about myself. I fixed that by coating it with ice cream, chocolate, pizza, chips, and Cakes...
I'm twenty-six now and weigh around twenty stone (5'7"). Despite some "success" in my life (I graduated from university and have a steady job as a nurse, a wonderful boyfriend, and a few good friends), I hate myself. I manifest this hatred with my eating - when I'm sad, I eat. When I'm lonely, I eat. When I'm bored, I eat. When I'm feeling bad about myself (most of the time!), I eat. “
ANSWERS:
STEP 2: Find themes:
Emotional Factors
Familial Influences
Societal/External Factors
STEP 4: Code and Identify all of the themes:
Emotional Factors
Emotional eating (comfort eating due to sadness, loneliness, boredom, self-loathing)
Emotional imbalance (mentioned as part of the tough times in adolescence)
Familial Influences
Parental example (mother's compulsive overeating and alcoholism)
Lack of parental support (mother's inability to provide guidance)
Negative comments from family (father's derogatory comparison to the mother)
Societal/External Factors
Social isolation (feeling isolated during adolescence)
Bullying/taunting (classmates taunting due to weight)
Physical abuse (brother's abuse contributing to self-loathing and eating for comfort)
STEP 5:
Operationalise themes and list synonymous words or related concepts that should be grouped to simplify the analysis
Synonyms and Related Expressions
Emotional Factors: Stress eating, eating due to emotions, using food as comfort.
Familial Influences: Family habits, parental behaviour, lack of emotional support from parents.
Societal/External Factors: Peer pressure, social bullying, external abuse
STEP 6: ANALYSIS: WHAT DOES IT ALL MEAN?
Remember: Although the process begins with research questions, it’s important to remember that they are not necessarily fixed. Revise definitions.

STEP 3: Make a coding frame with the themes you have discovered AND STEP 4: Code and Identify all of the themes:

.

STEP 3: Make a coding frame with the themes you have discovered,

